|
Associative report |
Scroll |
The following example will cover the creation of an associative report with links displayed in the form of properties, the placement of this report in a new fragment, the checking of link validity and report associativity, as well as report editing, table name insertion and associativity removal.
The following procedure is recommended.
Report creation
1.Open any file from an assembly, on which a report is needed.
2.Invoke the Create Report  command. The report settings elements will appear on the Parameters Toolbar.
3.In the Method group, press the Select all by all levels button.
4.In the Report Format section, enable the Associative Report and Data as links options, if they were disabled.
5.In the Advanced section, enable the To a new document option and select New document from the list, choosing the KOMPAS-Fragment variant.
6.Configure the style settings, as for a normal report (see section Simple report).
7.Proceed to placing the report in the document. To do this, disable the Data Processing Window option and click the Generate Report button  in the header of the Parameter Panel.
8.In the fragment, click on a location to set the snap point for the report.
9.The system will automatically return to the source document. To browse the new report, switch to the fragment where it has been placed.
|
Associative report with data in the form of links
Associative changes to the report
10.To check the associativity of a report, switch to the source document by calling the Open Source Document command from the fragment using the context menu of the report.
11.Add a new component to the assembly by any method and set values to its properties.
In the example, two Pump components were added.
|
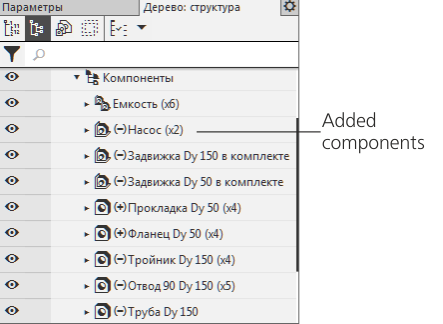
Adding a component into the source document
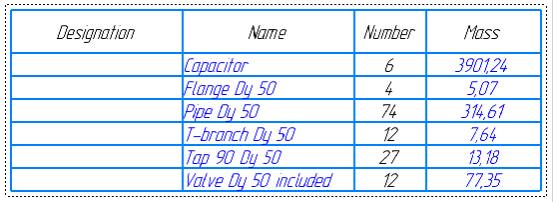
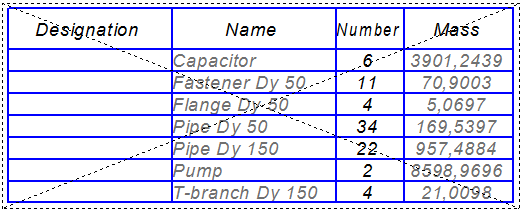
12.Proceed to the document, where the report has been placed. You will notice that the report is now struck–through, as the structure of model in the source document has changed.
13.Update the report. For that, call the Update Table command. After that, a new object will appear in the report: the Pump components with set properties.
|
Result of a report updating
14.Check how links in the report are displayed when the values of object properties are changed. For this purpose, switch to the source document by calling the Open Source Document command from the context menu of the report in the document.
15.Change a property value of any component. For example, you may edit the component name in the Model Design Tree, then rebuild the model by clicking the Rearrange  button on the Quick Access Toolbar.
In the example, the Container components are renamed into Vertical Reservoir.
|
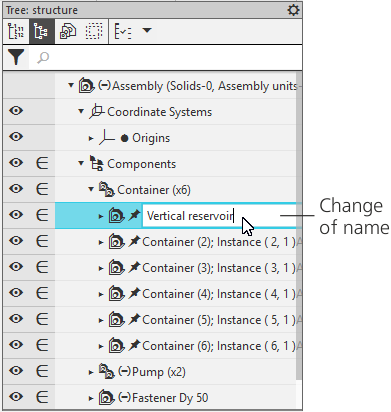
Changing property values in source document
16.Switch to the document where the report is located. The text color of property values is changed to the color of the links that require updating. The report is also displayed crossed out, which means changes in the source document.
|
Associative report after changing property values in source document
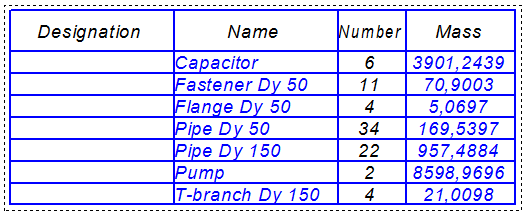
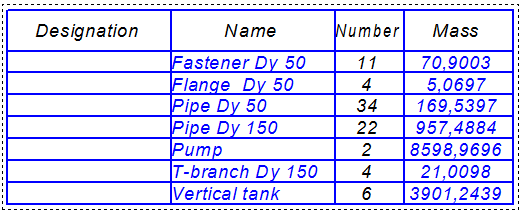
17.Update the report. For that, call the Update Table command from the context menu of the report. After that, the new name will be displayed in the report (with the sorting rules taken into account). The text color will change to the color set for links.
In the example, the Container object takes a different position after being renamed to Vertical Reservoir.
|
Result of a report updating
18.Find out how links are displayed upon the loss of relation to their source document. For this purpose, close the source document and temporarily rename it.
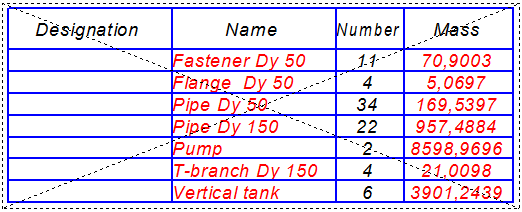
19.Switch to the document where the report is located. In it, the property values are displayed in a color that signifies loss of their source link, see figure.
|
Associative report after losing a relation to the source document
20.To restore the associative relation, rename the source document back to its former name. Now, when the document containing the report is opened, the text color will change to the color set for links.
Editing a report
21.Edit the report: for example, insert new text and divide the report into two tables located horizontally. For that, switch to the Data Processing Window by double–clicking the frame of the selected report or by calling the Edit in the Data Preparation Window command from its context menu.
|
First, perform any editing related to the re–designing (updating) of tables according to a model: for example, any set–up of style. Then, make changes to the text, insert and move rows, perform filtration of rows and any other actions. |

22.Configure the style. For example, set the number of rows on a page to 10. To do this, press the Set report style... button  on the Parameters Toolbar. In the Report Style Parameters dialog, press the Detailing button and enter the new value.
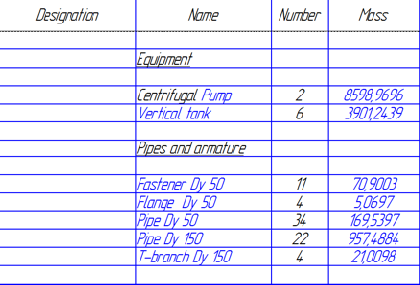
23.Set the Equipment section title, see the following figure. To do this, insert three empty rows anywhere in the table using the Insert Row Below  command on the Table panel.
24.Select the inserted rows and move them on top of the table using the Move row up  command.
25.Enter the text editing mode by double–clicking an empty row and enter Equipment as plain text. Apply underlining to it.
26.Similarly, set a caption for the Pipes and Fittings section.
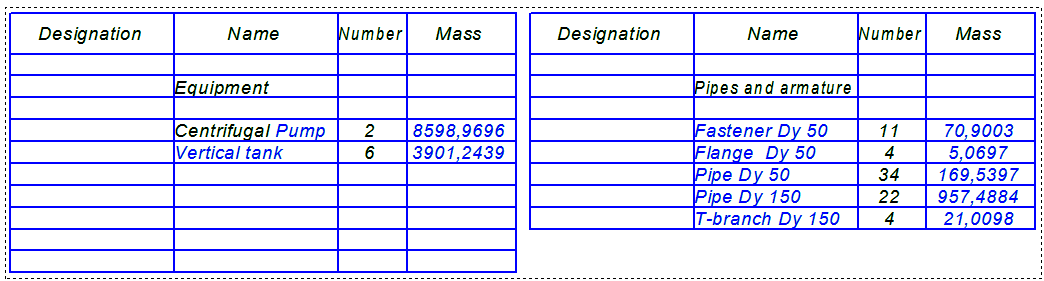
27.Edit the Pump row by adding some plain text after the link.
|
Editing a report in the Data Processing window
28.Split the table into two parts. For this purpose, select the row from which the second table should start. Then invoke the New Page  command on the Table panel.
29.To have the tables located horizontally, select the Down, Then to the Right option in the Detailing group on the Parameters toolbar.
30.Confirm the editing by clicking the Create report button in the header of the Parameter Panel.
|
An edited report in the document
The text of the report may be edited not only in the Data Processing Window, but also directly in the fragment field. For that, double–click a report row. Then, make any changes to the text in the cells.
Insertion of names
31.Insert names for each table. For that, call the Name... command from the context menu of the report in the document.
32.Enter text into the dialog fields.
In the example, Test area is entered in the first field and Continued Table is entered in the second.
|
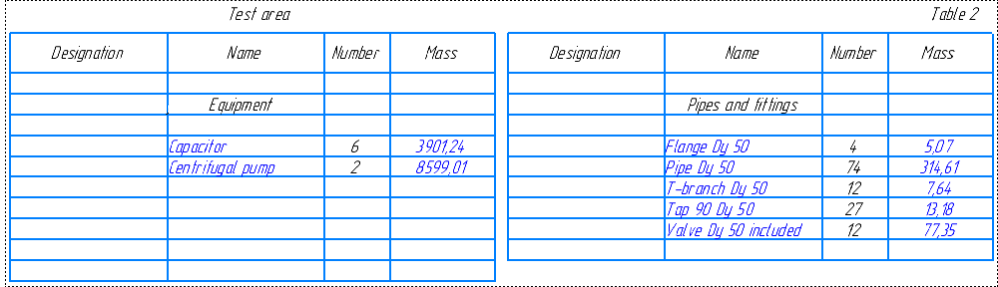
A report with table names