|
Curvature plot |
Scroll |
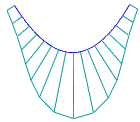
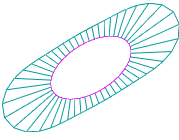
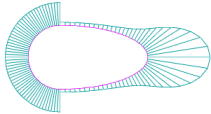
A curvature plot is used to evaluate the shape of a curve, the nature of curvature of the curve and its parts. The curvature plot is a graphic representation of curvature/curvature radius values based on the set of points along the curve. The curvature plot shows the curve smoothness and the mathematical curvature by displaying segments perpendicular to the curve ("needles") at these points. Lengths of these segments are proportional to the curvature values — the longer the segment, the greater the curvature value.
|
|
|

Examples of curvature plots
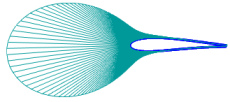
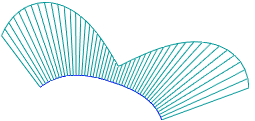
Ideally, a curve should have a smooth curvature plot, as in Fig. a). The angle at the plot indicates an abrupt change of the curve curvature, see Fig. b); a step indicates loss of smoothness, see Fig. c).
|
|
|
a) |
b) |
c) |
Changing smoothness on a curvature plot
You can set up the "needles" density and display scale when the plot is built.
The created curve curvature graph is also displayed during subsequent editing, automatically rebuilding itself when the curve shape changes.
Curve stress is one of the main characteristics of a curve's smoothness. The stress value of a curve can be calculated as the integral along the curve over the square of the curvature.
The stress value can be used to compare spline curves constructed from the same points or nearly identical curves. The lower the stress value, the smoother the curve is considered, and the more suitable it is, for example, for constructing surfaces of working elements of aerodynamic and hydrodynamic structures.
Curve stress calculation can be enabled when plotting the curvature graph. In this case, the calculated stress value for the curve will be displayed next to its curvature graph. When editing the curve, the stress value is recalculated, helping to control the curve's smoothness.