|
Parametric representation of the curve |
Scroll |
In the general case, the curve is mathematically described in the model file as the geometrical locus of points whose coordinates in space are determined by functions of the same t parameter:
x = x(t),
y = y(t),
z = z(t),
where the parameter t is limited by the limit values tmin ≤ t ≤ tmax.
Such description of the curve is its parametric representation.
Parametric region of the curve – this is the set of values of the parameter t, represented as a line segment (see Fig. a). The curve is a display of this segment in the three-dimensional space of the model. Each value of the parameter t corresponds to a specific point on the curve (see figure b).
|
|
a) |
b) |

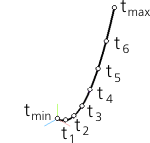
Semicubical parabola (Neile parabola):
a) parametric area of the curve — values of the parameter t;
b) mapping the values of the parameter t to the curve in three-dimensional space;
|
Please note that in general case the points that divide the parametric region of a curve evenly are mapped to the points on a curve that divide it unevenly. |

Consider a parametric representation of a semicubical parabola (Neile parabola).
The equation of the curve (or the law of the curve):
y 2 = a 2 · x 3, a > 0.
Parametric representation of the curve:
x = t 2,
y = a · t Row 3,
z = 0,
–∞< t < +∞.