|
Deviation analysis of a solid/surface from a polygonal object |
Scroll |
During design, you may need to compare the following objects:
•a solid/surface with a polygonal object (e.g., to determine whether a surface constructed from a polygonal object matches the object itself),
•a polygonal object with a solid/surface (e.g., to compare a scan of a finished product with the model from which it was manufactured),
•two polygonal objects (e.g., to compare scans of the same product performed with different settings),
•a solid/surface with another solid/surface (e.g., to select the most suitable from different solid/surface construction methods).
To compare these actions, a deviation analysis process is used.
During the analysis, the surface of one selected object (the object being inspected) is compared with the surface of the other (the source). Based on the results, a color map of the deviations is created and the maximum and minimum deviation values are determined.
If the object being inspected is a polygonal object, the deviations are measured at the vertices of the triangles into which its surface is divided. When inspecting a body/surface/face, a mesh is created on the surface of the inspected object, and deviations are measured at its vertices. A color map of the deviations is created based on this mesh.
The figures show examples of how color maps of deviations are displayed when comparing different objects.
|
|
|
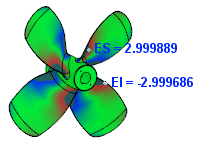
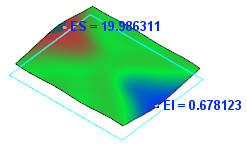
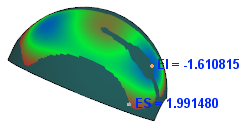
Displaying deviation color maps in various models
The Deviation analysis  command is used for deviation control.

Step-by-step instructions
1.Specify the object being checked and the object against which the check will be performed. To do this, activate the The object under test or Source object fields, respectively, and select the required object:
•a face of a body/surface (specified in the graphic area) or the entire body/surface (specified in the Design tree, which has the form of a structural representation, or in the graphic area if the corresponding filter is enabled),
•a polygonal object (specified in the graphics area or in the Design tree).
The selected object is highlighted, and its name is displayed in the corresponding field.
You can swap the specified objects, i.e., make the object under test the source object, and the source the object under test. To do this, click the Swap  button to the right of the object fields.
2.The deviation check is performed within the default range — Deviations map. If necessary, change the boundaries of this range using the field group Check limitations.
•In field Maximum distance enter the radius of the sphere defining the boundary of the test range. The center of the sphere is at the test point. Deviations which values fall outside the sphere are not considered in the analysis.
•In the Maximum angle field, enter the maximum angle between the normal of the inspected surface at the inspection point and the deviation vector at that point. Deviation vectors with an inclination angle greater than the specified value are not considered in the analysis.
The figure shows a diagram for defining the inspection range. The gray areas represent conical regions within a sphere whose radius is equal to the maximum distance. The angle at the cone's apex is equal to twice the maximum angle.
|
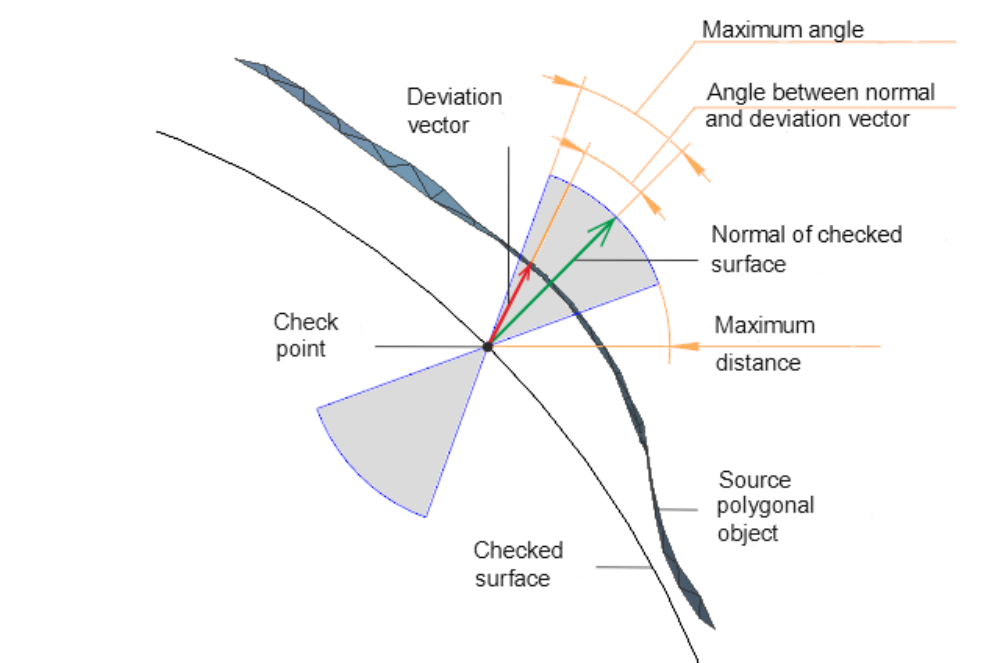
Parameters defining the range of testing
3.Customize the display of deviations on the color map using the Deviation map group of elements.
The map's color palette is displayed in the Parameters Panel as a rectangle. The color distribution on the map depends on the boundary values of the displayed interval, which are calculated by the system relative to the verification range (see the previous section) and are shown in the Min and Max fields. These values appear after specifying comparison objects and are automatically recalculated after the verification is completed. The resulting boundaries of the displayed interval can be modified (see below).
If the verified object is a solid/surface or the edge of a solid/surface, you can configure the precision—the number of points at which the deviation calculation will be performed. More about deviation color map...
If required, enable the display of the permissible range. To do this, set the Permissible range switch to I (on) and specify the boundaries of this range. Learn more about setting the permissible range...If required, enable the display of the permissible range. To do this, set the permissible range switch to I (on) and specify the boundaries of this range. Learn more about setting the permissible range...Learn more about setting acceptable range...
4.To calculate deviations, click the Run check link in the Results table header of the Parameter Panel (the link appears after specifying the comparison objects).
While the calculation is in progress, a progress indicator is displayed in the graphical area. You can stop the process by clicking the Cancel button in the progress bar or the Stop link in the Results table header.
Once the calculation is complete, a color map of deviations, based on the specified parameters, appears in the graphic area. It is displayed on the surface of the object being checked. The original object is hidden.
As you move the cursor over the color map, deviation values are displayed next to it. Each value corresponds to the deviation at the point on the object under the cursor.
The color map displays points corresponding to the maximum deviations (upper and lower) within the specified check range. These values are also displayed in the Results table of the Parameters Panel. When a table row is selected, the corresponding point in the graphical area is highlighted. If the deviation map the display of the acceptable range is enabled, then the table also shows the number of points that fall within this range.
You can display the data given in the table, as well as the number of measurement points, in Information window. To do this, click the Show in the information window  button, located above the table. This button is available if the table contains analysis results.
If the display of the acceptable range of values is enabled on the deviation map, the table also displays the number of points falling within this range. You can display the data in the table, as well as the number of measurement points, in the Information Window. To do this, click the Show in Information window button.
5.If necessary, change the boundaries of the interval of displayed deviations by specifying the desired values in the fields Min and Max. The distribution of colors on the map will change. More about setting the deviation display interval...
You can also enable/disable the display of the acceptable value range and change its boundaries. These changes will be reflected in the graphic area.
6.If required, change the display precision of the analysis results and the units of length measurement using the elements in the Information Format section (description of the elements is given in the section Measurement parameters).
7.To save the analysis parameters and its results, click the Save button in the Parameters panel header.
In the Design Tree, which has a structural representation view, in section Diagnostics  , in subsection Deviation analysis
  the object Deviation analysis will appear.
Saving the results doesn't stop the command. You can change the analysis parameters, such as the precision or range of the test, swap the tested and source objects, or select different objects for comparison. When such changes occur, the text Conditions changed and a Recalculate link appear in the Results table header. Click this link to recalculate.
You can save the changed data by clicking the Save button again. Saving is done in the same object Deviation analysis , i.e. data that was saved previously will be overwritten.
You can save the changed data by clicking the Save button again. The data is saved to the same Variance analysis object, meaning any previously saved data will be overwritten.
|
Analysis results are stored only during the current model session. Object selection and analysis parameters are retained in the model even after the current session ends. |

8.To exit the command, click the Exit  button in the Parameters panel header.
|
You can recalculate the deviations later, for example, if the geometry of the objects being inspected has changed. To do this, select the Run Validation command from the context menu of the Deviation analysis You can also edit the analysis parameters using the Edit |
