|
Deviation color map |
Scroll |
In progress deviation analysis A color map of the deviations is generated. It appears on the screen after clicking the Run check button on the Parameters Panel.
The color map is displayed in a graphical area on the surface of the inspected object. It shows the distribution of deviation values using different colors. If a surface area is dark gray, the deviations are outside the inspection range. A color map is not generated for such areas.
Deviation color map. Displayed value symbols setting
Setting up the display of the acceptable range values
Map parameters are configured using the Deviations map group of elements.
Map Color Palette. Configuring the Display Range of Values
The range of values displayed on the map is calculated by the system based on the validation range, which in turn is determined by the values in the fields Maximum distance and Maximum angle of the group Check limitations. The limits of the values displayed on the map are shown in the fields Min and Max, located in the Parameters Panel below the color palette. The values in the fields appear after you specify the comparison objects.
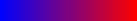
The color palette used on the map is represented in the Parameters Panel as a rectangle.
|

The colors in the palette correspond to specific deviation values: shades of red correspond to deviations close to the value specified in the field Max (i.e. to the upper boundary of the displayed interval), blue - to the value in the field Min (i.e. to the lower boundary of the displayed interval), and green to the average values between them.
After completing the check (clicking on the link Run check) of the value in the fields Min and Max are automatically recalculated. The range of values is set as "symmetrical" around zero. Surface areas of the inspected object are colored according to the calculated deviation values.
If necessary, you can change the range of deviations displayed. To do this, enter the desired values in the fields Min and Max (the interval boundaries must not exceed the test range.) The color distribution on the surface of the tested object will change.
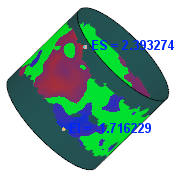
The figures show how the colors on the deviation map change as the boundaries of the displayed interval change. Figure a corresponds to the interval whose boundaries are defined by the system. The map is predominantly green, as in the given example, most of the deviations have values close to the middle of this interval. If the mean value of the interval is entered as the lower boundary, most of the surface becomes blue (Figure b), and if as the upper boundary, it becomes red (Figure b).
|
|
|
a) |
b) |
c) |
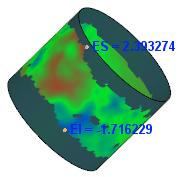
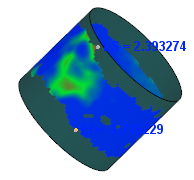
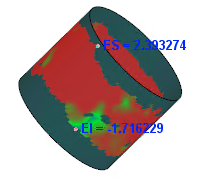
Dependence of colors on the deviation map on the boundaries of the displayed interval
|
When the value in the Maximum distance field is changed, the range of values displayed on the map is automatically recalculated. |

If the object being checked is a body/surface or a face of a body/surface, you can change the number of points at which deviations will be calculated. This is done using the Precision field group (appears in the Parameters Panel when a body/surface/face is specified for checking).
The Precision group contains two fields: one with a «slider and one with a numeric value. You can set the desired precision by moving the «slider or enter a value manually. Moving the «slider changes the numeric value in the second field. Entering a value manually automatically moves the «slider. The precision value can be an integer between 0 and 10.
This allows you to change the density of the triangulation grid on which the color deviation map is displayed. To obtain a more accurate deviation map, increase the value in the field; to obtain a less accurate deviation map, decrease the value.
The fewer points tested, the coarser the color map. Reducing the precision is worthwhile, for example, in the case of a very complex model. This will speed up the calculation of deviations, but will degrade the visual perception of the result. Accordingly, the more points tested, the more detailed the color map, but the longer the calculation time.
|
If a polygonal object is being checked, deviation calculations are performed at the vertices of the triangles into which its surface is divided. The number of check points cannot be changed. |
When the precision is changed, the text "Conditions changed" and a Recalculate link appear in the results table header on the Parameters Panel. Click this link to perform the calculation according to the specified precision.
Setting up the display of the acceptable range of values
In some cases, it's necessary to highlight on the map areas of the surface where deviations are within acceptable design limits. This is done using the Acceptable Range toggle.
Set the switch to position I (on). The color distribution on the surface of the object being inspected will change.
Deviation values that fall outside the acceptable range will be shown in the colors shown on the palette.
|
Shades of blue and red still correspond to deviations close to the boundaries of the displayed range (see above), and shades of purple are now used for average values (except those within the acceptable range). Green is no longer present in the palette. This color will be used to display surface areas with acceptable deviation values.
By default, the valid range is between -0.05 and 0.05. You can change the boundaries of this range using the corresponding Min and Max fields (the specified values must not exceed the validation range). When the values in the fields change, the color distribution on the map in the graphic area also changes.
The figures show how the color map changes when deviations within the acceptable range are highlighted. In figure a, the acceptable range display is disabled, while in figure b, it is enabled.
|
|
a) |
b) |
Highlighting the acceptable range of values on a color map
Viewing deviation values on a map
The color map displays points corresponding to the maximum deviations (upper and lower) within the specified inspection range. These values are also displayed in the Parameter Panel table.
As you move the cursor over the color map, deviation values appear next to it. Each value corresponds to the deviation at the point of the object under the cursor.
The deviation map is not generated for dark gray surface areas. Therefore, when hovering over such an area, the value is absent.