|
Curvature plot |
Scroll |
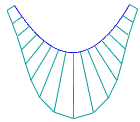
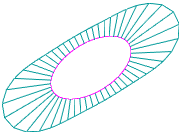
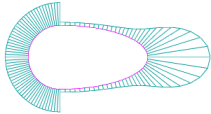
A curvature plot is used to evaluate the shape of a curve, the nature of curvature of the curve and its parts. The curvature plot is a graphic representation of curvature/curvature radius values based on the set of points along the curve. The curvature plot shows the curve smoothness and the mathematical curvature by displaying segments perpendicular to the curve ("needles") at these points. Lengths of these segments are proportional to the curvature values — the longer the segment, the greater the curvature value.
|
|
|

Examples of curvature plots
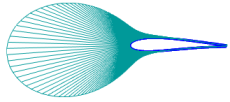
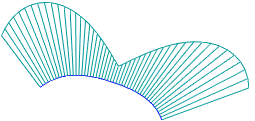
Ideally, a curve should have a smooth curvature plot, as in Fig. a). The angle at the plot indicates an abrupt change of the curve curvature, see Fig. b); a step indicates loss of smoothness, see Fig. c).
|
|
|
a) |
b) |
c) |
Changing smoothness on a curvature plot
You can set up the "needles" density and display scale when the plot is built. The curvature plot changes automatically when the curve shape is changed.