|
Projection curve |
Scroll |
You can plot a projection curve – a projection of a selected (base) curve onto a projection surface.
|
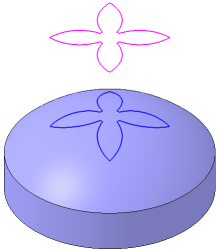
Projection of a sketch to a face of a solid
You can use the following as a projection surface:
•a face of a solid or a surface;
•coordinate plane or construction plane;
•a set of these objects.
You can use the following as the base curve:
•a spatial curve (including an array instance),
•edge of a solid or surface,
•sketch line,
•coordinate or construction axis,
•an array of curves,
•a set of these objects.
|
The use of curves with subordinate curve-objects (intersection curves, groups of isoparametric curves, etc.) has its peculiarities. Details... |

|
Please note the following concerning plotting the projection curve: •You cannot plot a projection of an axis to a plane. •If the projection of the base curve on a surface degenerates into a point, it cannot be plotted. •An axis projection can be plotted if this projection is within the projection surface. |
To construct a projected curve, use the Projected Curve command  .
.

Step-by-step instructions
1.Specify the faces and/or planes in the graphic area to project the curve on. You can select a solid or a surface in the Design Tree if the current set if you need to select all the faces of a solid or surface. The name of the selected object(s) is displayed in the Surface field on the Parameters toolbar. For more details on selecting and specifying objects...
2.Select the base curve in the graphic area. The name of object(s) is displayed in the Curves field on the Parameter Panel.
A phantom of the projection curve will be displayed in the graphic area. The projection curve may consist of one or several separate contours.
3.Select the method of projecting the base curve using the group of elements Projection type:
 By normal to surface
 By Direction
Details...
4.Select the option Trimming by boundaries variant of base curve projection — within the contour of the face or considering the theoretical surface of the face.
Details...
5.Select the contours to plot if needed. Details...
6.You cat set the name, The color and display parameters of projection curve. To do that, use the Properties section.
7.To complete the operation, click Create an object  button.
The projection curve will appear in the graphic area, and the object with its icon will be displayed in the Design Tree; the object includes sub-objects corresponding to the number of separate contours within the curve.
|
Absence of the phantom means that the curve cannot exist for the selected source objects. |
8.To complete operation of the command, click the Finish button  .
.