|
Settings of the graphic of curvature |
Scroll |
When the command is first called, the graphic of curvature is displayed on a phantom with calculated optimum (default) parameter values for the current model scale. You can change the plot view by adjusting the "needles" density and display scale. Parameter configuration is performed in the Curvature plot section. For a detailed description, see the sections below.
Density
To set up the "needles" density on the curvature plot/curvature radius plot, use the Density field. This field represents a movable horizontal scale with evenly positioned vertical marks. The scale can be moved endlessly to the left and to the right of the fixed vertical mark situated in the center.
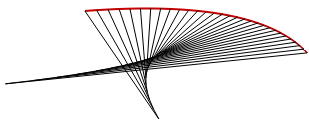
•To increase the "needles" density, position the cursor on the scale and press the left mouse button. While holding the button pressed, move the scale to the right – the "needles" density on the phantom will increase, see Figures a and b.
•To decrease the "needles" density, position the cursor on the scale and press the left mouse button. While holding the button pressed, move the scale to the left – the "needles" density on the phantom will decrease (the minimum density value is 3), see Figure a and Figure c.
|
|
|
a) |
b) |
c) |
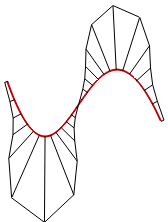
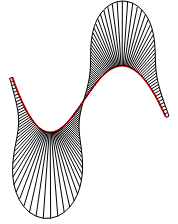
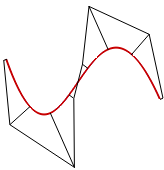
Setting the "needle" density on the curve curvature plot:
a) default value, b) increasing "needles" density, c) decreasing "needles" density
You can use the mouse wheel to set up density. Position the cursor on the scale and rotate the mouse wheel forward or backward. Accordingly, the scale will move to the right or to the left and the "needles" density on the phantom will smoothly increase or decrease. This method is convenient when you need to slightly change the parameter.
If you want to restore the default density value, click the name of the field Density.
You can enter the density value manually to the right of the field Density.
Scale
The "needles" display scale is set up in the Scale field. This field represents a movable horizontal scale with evenly positioned vertical marks. The scale can be moved endlessly to the left and to the right of the fixed vertical mark situated in the center.
•To increase the "needles" display scale, position the cursor on the scale and press the left mouse button. While holding the button pressed, move the scale to the right – the "needles" display scale on the phantom will increase, see Figure a) and Figure b).
•To decrease the "needles" display scale, position the cursor on the scale and press the left mouse button. While holding the button pressed, move the scale to the left – the "needles" display scale on the phantom will decrease, see Figure a and Figure c.
|
|
|
a) |
b) |
c) |
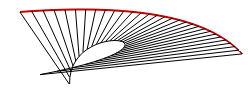
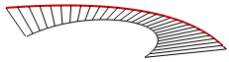
Setting the display scale of "needles" on the curvature radius plot:
a) default value, b) increased scale, c) decreased scale
You can use the mouse wheel to set up display scale. Position the cursor on the scale and rotate the mouse wheel forward or backward. Accordingly, the scale will move to the right or to the left and the "needles" display scale on the phantom will smoothly increase or decrease.
If you want to restore the default scale value, click the name of the field Scale.
The scale value can be entered manually to the right of the field Scale.