|
Curvature plot |
Scroll |
The graphic of curvature is a graphic representation of curvature values based on the set of points along the curve. Curvature values are displayed on the plot in the specified points of the curve as normals, or "needles". You can build a graphic of curvature or curvature radius.
|
|
a) |
b) |
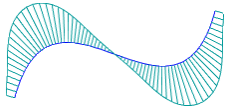
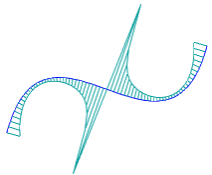
Examples of curve curvature plots:
a) curvature plot, b) curvature radius plot
More details on the curve curvature plot...
To build a curvature plot, use the Curvature Plot  command.

Step-by-step instructions
1.In the graphic area or in the Design tree, specify the curve for which you want to build a curvature plot (the curve can be specified before calling the command).

The curve name is displayed in the Objects field on the Parameters toolbar. A phantom of the curvature plot with default settings is displayed in the graphic area.
2.Select the plot type — curvature plot or curvature radius plot. The Values toggle switch in the Curvature graph section on the Parameters panel is used for this purpose.
By default, the curvature plot is displayed on the screen. The Values toggle switch is set to Curvature. To build a curvature radius plot, set the toggle switch to Curvature Radius.
3.If required, set up the "needles" density and display scale on the plot in the Curvature Plot section. More details about the setting up of the graphic of curvature...
4.If required, specify the plot color in the Properties section.
5.To save the plot (objects as well as parameter settings will be saved), click Save  in the header of the Parameters Panel.
The curvature plot will be displayed in the graphic area, and in the Model tree in the Diagnostics section the object Curvature Plot will appear. N with the corresponding icon . If multiple curves were specified during the command execution, a separate object will be created for each of these curves.
6.To complete the command, click Finish  in the heading of the Parameter panel.
For a curve, you can only build a single graphic of curvature. When you build a new plot, the previous one will be edited.
|
The curvature plot changes automatically when the curve shape is changed. |