|
Grid of curvature plots |
Scroll |
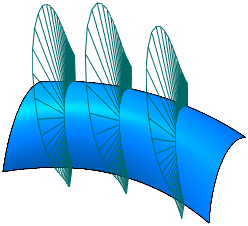
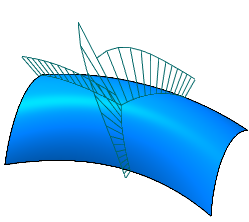
Grid Graphics of curvatureIt is used for analyzing the curvature of the surface. The grid of curves for which plots are built is formed at the intersection of the specified surface with a defined set of surfaces (sections). Below are examples of curvature plots with parallel (Figure a) and radial (Figure b) locations of sections.
|
|
a) |
b) |
Grid of curvature plots
More details on curvature plot grid...
To build a curvature plot grid, use the Grid of curvature plots  command.

Step-by-step instructions
1.In the graphic area, specify a non-flat face(s) for which you want to build a curvature plot grid.
The name of the edge is displayed in the Objects field on the Parameters toolbar. A phantom of the curvature plot grid with a center in the point of the face specification and with default settings is displayed in the graphic area.
2.Set the position of the curve grid center. Enter the values of U parameters and V parameters in the UV parameters, % field in the Surface Curve Mesh section, or specify a point object.
3.Select the option of the sections position. To do this, click the appropriate button in the Location of cross sections group.
 Parallel — the sections will be arranged parallel to the base plane (the base plane passes through the grid center) with an equal step. Specify the plotting method for the section in the Method:
 Perpendicular to the tangent plane
 By Object
More details on methods of plotting parallel sections...
 Radially — sections will be positioned radially relative to the normal passing through the center of the grid, perpendicular to the plane tangent to the surface at the center point. The stroke between the sections is set in circular direction from the base plane.
4.Set up the curve grid parameters: set the number of sections, the stroke between them, etc. More details on setting the curve grid parameters...
5.Select the curvature plot type — curve curvature plots or curvature radius plots. Set the switch to the desired position Values in the section Curvature graph on the Parameter Panel.
6.Set up density and display scale of the curvature plots "needles" in the Curvature plot on the Parameters Panel. In detail settings Described in Curvature plot command.
7.If required, specify the curvature plot color in the Properties section.
8.To save the curvature plot grid (objects as well as parameter settings will be saved), press the Save  button in the title of the Parameter Panel. You can set the grid name in the Name field in the Properties section.
The grid of curvature plots will be displayed in the graphic area, and the relevant object will appear in the Model tree in the Curvature Plots section.
9.To complete the command, press the Finish  button in the heading of the Parameter panel.
Tips
In the graphic area, you can set the position of the curve grid center, the stroke (angle) between sections and the rotation angle in the tangent plane by using defining points (for information about defining points, see section Defining Points of Objects).