|
Curve by two projections |
Scroll |
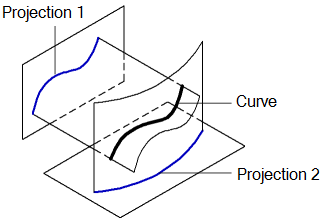
You can plot a curve based on two sketches located in non-parallel planes. Lines in sketches are considered orthogonal projections of the constructed curve onto the planes of these sketches. The curve is therefore plotted as the curve of intersection of two surfaces established by displacement of the given projections along the directions perpendicular to their planes, see the figure.
|
Plotting a curve by two projections
To plot a curve by two projections, use the Curve by two projections  command.

Step-by-step instructions
1.Specify the first projection: a sketch or individual lines of a sketch. To make selecting a sketch in the graphic area easier, you can enable a sketch Filter sketches. Please note that this filter is only applicable when creating a curve by two projections. You can also select the sketch in the Design Tree.
The name of the selected object (objects) is displayed in the Projection 1 field on the Parameters toolbar. For more details on selecting and specifying objects...
2.Specify the second projection in the same way as the first one. The object name is displayed in the Projection 2 field on the Parameters toolbar.
A phantom of the curve being created will be displayed in the graphic area. It may consist of one or several contours.
3.Select the outlines to plot if needed. Details...
4.You cat set the name, The color and Display parameters curve by two projections. To do that, use the Properties section.
5.To complete the operation, click Create an object  button.
The curve by two projections will be displayed in the graphic area, and in the Design Tree, an object with its icon and subordinate objects corresponding to the number of separate contours in the curve.
6.To complete operation of the command, click Finish  button.
|
Absence of the phantom means that the curve cannot exist for the selected source objects. |

See Also
Notes on working with curves having subordinate objects-curves