|
Curvature map |
Scroll |
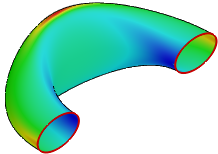
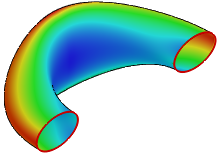
Curvature map allows to visually check the surface curvature using a color palette. The selected objects are colored according to the calculated curvature values. Values in the red part of the spectrum indicate the maximum curvature in the current curvature value range, while those in the blue part indicate the minimum. By default the curvature map displays the full range of curvature values. It is calculated automatically according to the preset curvature values for the selected objects.
To display the curvature map, set the Curvature Map toggle switch to position I (enabled). The selected objects will be colored according to the default settings, and the Parameters Toolbar will display the controls to configure the curvature map.
In the Method field, select a curvature representation option. There are several possible variants – Gaussian, Median, etc. More details on options for presenting curvature...
Under the Method field, there is a color scale used to designate curvature values. In the fields Min and Max, the current values of the minimum and maximum curvature are displayed; they serve an informational purpose.
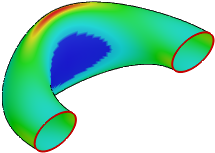
The slider in the Scale field allows you to adjust the range of values displayed on the curvature map. The 100% scale (used by default) means full range of the curvature values. The range may be decrease, if needed. This allows to increase the contrast of the curvature map for some areas of the surface, in order to see more details in the middle area of the full curvature values range.
Move the slider to the right to increase the scale, or to the left to decrease it. The field with the numeric value is located to the right of the Scale field. Here you can see the current scale value and enter a new value.
The slider in the Center field allows you to set the position of the curvature range center. If the center is located in the middle of the range, the color palette is evenly distributed between the maximum and minimum curvature values.
If the slider in the Center field is moved to the left from the middle of the range, it allows for a more detailed examination of the curvature values at the beginning of the range. Reciprocally, moving the slider to the right allows to see more detail in the higher part of curvature range.
Enabling the Increased Precision option improves the accuracy of calculations when computing curvature.
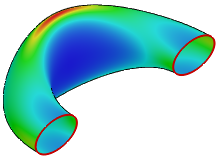
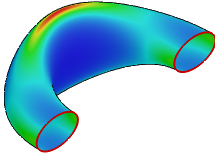
The figure shows curvature maps with different settings for value ranges (range center in the middle).
|
|
a) |
b) |
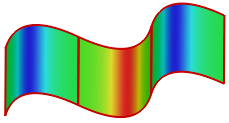
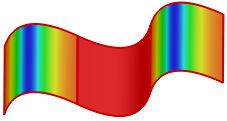
Median curvature map
a) Full curvature value range, b) Value range reduced
Options for representing curvature
For curvature map creation you can use different options of curvature representation. Those options are summarized in the table.
Variants of curvature representation
Curvature |
Example of color map |
Features for curvature analysis |
|
Gaussian The formula for calculation — k1*k2, where •k1 — the curvature at a point along the first principal direction, •k2 — curvature at the point along the second principal direction. |
|
•General analysis of surface curvature. •Identification of convexities, saddles, and flattenings. •Analysis of surface developability. •Evaluation of surfaces mating (not for all cases). |
|
Mid Calculation formula — (k1+k2)/2, where •k1 — maximal curvature •k2 — minimum curvature |
|
•General analysis of surface curvature. •Evaluation of surface compatibility. |
|
Maximum |
|
•Technological analysis – compliance with the criterion of the minimum radius of curvature in production (during bending, milling with a ball-end cutter, etc.). •Detection of flattenings |
|
By direction U |
|
Curvature at the point along direction U. |
|
By direction V |
|
Curvature at the point along direction V. |