|
Deviation analysis of a solid/surface from a polygonal object |
Scroll |
In the design process, you may need to determine whether it corresponds to solid (surface) polygonal object, built on its basis . To do this, deviation analysis of the body's edges (surfaces) from the edges of the original polygonal object is performed. Based on the results of the analysis, a color map of deviations is built, and the maximum and minimum deviation values are determined. Examples of displaying color deviation maps are provided in the figures.
|
|
|
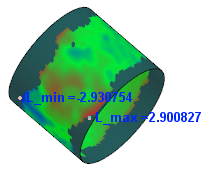
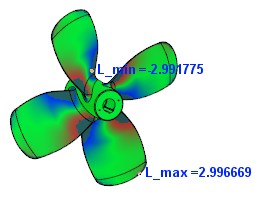
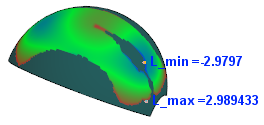
Displaying deviation color maps in various models
The Deviation analysis  command is used for deviation control.

Step-by-step instructions
1.Specify the object under test:
•face of a solid (surface) is specified in the graphic area,
•entire solid (surface) is specified in the Design tree, appearing as structural representation, and in the graphic area if the corresponding filter is enabled.
The specified object is highlighted, its name is displayed in the field The object under test.
2.Specify the polygonal object relative to which the test will be performed. An object can be specified both in the graphic area and in the Design tree. The name of the selected object is displayed in the Base object field.
When both objects are specified, a color deviation map appears in the graphic area (see below), which is built considering default parameter values. On the surface under test, points corresponding to extreme deviation values within the given range are also marked — maximum positive value and maximum negative value.
3.The deviation analysis is performed within the default range. It's available to change the default range boundaries if needed. To that end:
•In the Maximum distance field, enter the value that will be measured in both directions from the tested surface and define the boundaries of the range. Deviations which values exceed the specified limits are not taken into account during the analysis.
•In the Maximum angle field, enter the threshold value of the angle between the normal to the surface under test at the check point and the deviation vector at this point. Deviation vectors with a slope angle exceeding the specified value are not taken into account during the analysis.
4.The Deviations map elements group is used for working with the color deviation map. The color palette of the map is displayed here. The distribution of colors on the map is determined by the values in the Min and Max fields. These values are calculated by the system depending on the range in which the analysis is performed:'
If necessary, it's available to change the displayed deviation range by entering the required values in the Min and Max fields. The distribution of colors on the map will change. For more details on working with the color deviation map...
5.Extreme deviation values are displayed in the graphic area and in the Results table on the Parameter panel. When a row is selected in the table, the corresponding point in the graphics area is highlighted. It is possible to display the deviation values, as well as the number of measurement points in Information window. For this, click Show in the information window  above the table. The button is available if the table contains analysis results.
6.If necessary, change the accuracy of the display of analysis results and the unit of length measurement using elements of the Information format section (a description of the elements is provided in the section Measurement parameters).
7.To complete the analysis with saving results, click Save  on the Parameter panel header.
In the Design tree, in the Diagnostics section, an object with the corresponding icon will appear.
8.To complete the command, click Finish  in the header of the Parameter panel.