|
Spline |
Scroll |
In KOMPAS-3D, you can plot:
These objects are plotted by setting points. The coordinates of the points, as well as their other parameters, are displayed in the Point parameters table. You can import data into the table from an external file or export the data from the table to a file. Details...
|
The spline plotting commands are combined in a group. While executing a group command, you can switch to execution of another one using buttons of the Parameter Toolbar header. You can also transfer any parameters you’ve specified between the commands of a group. More information on parameters transfer... |

To plot a Spline by Vertices, you have to set a series of points this spline should pass through.
To build a spline, use the Spline through points  command.

Step-by-step instructions
1.Please select the spline plotting type: closed or open. To do that, use the Close Curve option.
2.You can change the spline degree in the Order field. The spline degree can take values in the range from 2 to 10.
More details on the arrangement of spline curves...
3.Set the first point of the spline. This point is plotted using the By coordinates  method.
4.To plot a point by coordinates:
•in the graphic area:
•setting the point position using the mouse,
•on the Parameter Panel using the controls from the Vertex Design group:
•entry of point coordinates into the Coordinates field,
•constructing a special point (using the Create Point button  , positioned next to the Snap Point field).
When you set a point object or plot a special point, an associative link is automatically created between this object (point) and the resulting spline point. The applied links are marked with special icons in the Point parameters table. When you select a spline point, the name of the related object (or point plotting method) is displayed in the Snap Point field. You can delete the link if needed. More details on the associative link...
5.Select the method for plotting the next point using the group of buttons Method and plot the point. Available plotting methods:
•Plotting by coordinates — see above.
•Constructing in the direction of one of the axes — press the button corresponding to the desired axis ( ,
,  or
or  ), and set the point offset. Details...
•Constructing in the direction parallel or perpendicular to the object — press the button corresponding to the required direction (  or
or  ), select the guiding object, and set the point displacement. Details...
6.Plot the other spline points the same way.
When defining points, you can view their parameters: for a newly defined point — in the group of elements Vertex Design, and for already defined points — in the Point parameters table, located in group Vertex Coordinates.
A phantom of the spline with current settings is displayed in the graphic area. The phantom may look different depending on the state of the option Close Curve.
7.If you need to edit the spline configuration, please switch to the editing mode. In this mode, you can:
•change the position of the points, choose other plotting methods
Changing the position of points
•delete points, create points on existing parts of a spline
Inserting an aggregate of points
•modify the spline shape in points using matings or by modifying the parameters of the tangent vectors and the curvature
Mating spline with model objects
After making changes, you can continue specifying points by returning to the Creation mode.
8.If necessary, make the spline shape smoother. Smoothness is achieved by the spline ceasing to pass through some of the defined points. To control smoothness, use the Smoothening section on the Parameter Panel. Details...
9.You can select a coordinate system to place the spline. To do this, use the Coordinate System section. Details...
10.You cat set the name, color and display parameters of the created spline in the Properties section on the Parameter Panel.
11.To complete creating the spline, click Create Object  .
.
The spatial spline will appear in the graphic area; its icon will appear in the Design Tree . The given points of the spline will also be displayed in the tree. They are subordinate to the spline.
12.To complete operation of the command, click Finish  .
.
To plot a sSpline by Poles, you need to set the vertices of its characteristic broken line. The number of vertices is determined by the spline degree.
Boundary points of the spline coincide with the terminal vertices of the broken line; the first and the last segments of the broken line are tangential to the spline in the start and in the end points, respectively. Other vertices of a broken line are the poles of the spline. The points of the spline do not coincide with the poles, but are located at some distance from them. This distance depends on the weight of each pole.
The spline degree can take values in the range from 2 to 10; and the weight — in the range from 0.0001 to 999. Fore more details on spline degree and point weight, see Section Spline curves and surfaces. Degree of curves. Weight of the points Add-Ons Curves and Surfaces.
For constructing Spline by Poles, the Spline by poles command is used  .
.
Step-by-step instructions
1.Please select the spline plotting type: closed or open. To do this, use the Close Curve option.
2.Set the spline degree in the Order field.
3.Select the first vertex of the characteristic broken line of the spline. This vertex is constructed using the By coordinates method.
To plot a vertex by coordinates use the following methods:
•in the graphic area:
•setting the point position using the mouse,
•on the Parameter Panel using the controls from the Vertex Design group:
•entering of point coordinates into the Coordinates field,
•constructing of a special point. (using the button located next to the Snap Point field).
When you set a point object or plot a special point, an associative link is automatically created between this object (point) and the resulting spline point. The applied links are marked with special icons in the Point parameters table. When you select a spline point, the name of the related object (point plotting method) is displayed in the Snap Point field. You can delete the link if needed. More details on the associative link...
4.Select the method for plotting the next vertex using the Method group of buttons, and plot the vertex. Available plotting methods:
•Plotting by coordinates — see above.
•Construct in the direction of one of the axes — click the button corresponding to the desired axis (, , or ), and specify the point displacement. Details...
•Construction in the direction parallel or perpendicular to an object — press the button corresponding to the required direction ( or ), select the guiding object, and set the point offset. Details...
5.Plot the other vertices of the characteristic broken line the same way.
When specifying vertices, you can view their parameters: for a newly specified vertex — in the Vertex Design group, and for already specified vertices — in the Point parameters table, located in the group Vertex Coordinates.
A phantom of the spline with current settings is displayed in the graphic area. The phantom may look different depending on the state of the option Close Curve.
6.Using the Weight field, you can set the weight of any defined vertex of the broken line. You can set the weight before the vertex is defined or when editing its parameters (see the next section for more details on editing mode).
7.If you need to edit the spline configuration, please switch to the editing mode. In this mode, you can:
•change the position of the vertices of a broken line, choose other plotting methods
modify the position of the points in
•delete vertices of a broken line, create vertices on existing parts of a spline
•modify the spline shape in points using matings
mate spline with model objects
•modify the weight of any vertex; to do that, select a vertex and enter the weight value in the Point weight field. You can also set the Pole Weight in the Weight column of the Point parameters table.
After making changes, you can continue defining the vertices of a broken line by going back to the Creation mode.
8.You can select a coordinate system to place the spline. To do that, use the Coordinate System section. Details...
9.You cat set the name, color and display parameters The properties of the created spline will appear in the Properties section on the Parameter Panel.
10.To complete creating the spline, click Create Object .
The spatial spline will appear in the graphic area; its icon will appear in the Design Tree . The given points of the spline will also be displayed in the tree. They are subordinate to the spline.
11.To complete operation of the command, click Finish .
|
The Metaspline command is experimental and included in KOMPAS-3D v21 for the purpose of gaining practical experience and evaluating its capabilities. |

The Metaspline command is intended for creating high quality splines, which implies not only smoothness but also smooth curvature (i.e., minimal number of curvature extrema and rate of its change). Spline is created on base of a characteristic broken line by geometric constructions. It is useful for designing of external curves for aero– and hydrodynamic surfaces, cam dog profiles, road centerlines, working surfaces of blades, screws and turbine buckets, and tilling machines.
|
When using the Metaspline command, there is a probability that on certain characteristic polylines the expected result will not be achieved: either the curve will not be constructed, or the constructed curve will not be smooth and continuous. The curve quality might be assessed visually or with the help of Graphic of curvature. In any case the decision to apply the drawing result is made by user. |
To plot a spline, you need to set the vertices of its characteristic broken line. The created curve may pass through vertices of a characteristic broken line or be tangent to segments of the broken line. The following figure presents some examples of different splines built on base of a same characteristic broken line. The characteristic broken line and its vertices are pink in this drawing, and the finished curve is blue.
|
|
a) |
b) |
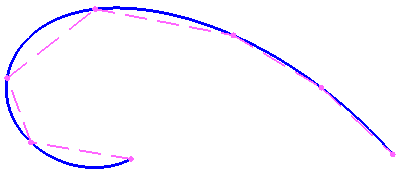
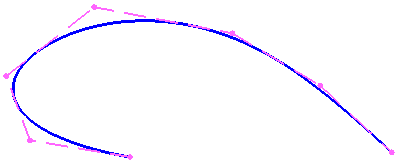
Spline drawing
a) through vertices of the broken line, b) with tangency to segments of the broken line
You use the Metaspline  command to construct a metaspline.
Step-by-step instructions
1.Please select the spline plotting type: closed or open. To do that, use the Close Curve setting.
2.Select the type of spline in the Curve Type group. The following options are available:
 By points — the spline goes through the vertices of the characteristic polyline.
 With a touch — the spline touches the segments of the characteristic polyline.
3.Select the first vertex of the characteristic broken line. This vertex is built using the method By Coordinates .
To plot a vertex by coordinates, the following methods are used:
•in the graphic area:
•setting the point position using the mouse,
•on the Parameter Toolbar using the controls from the group Vertex Design:
•entering of point coordinates into the Coordinates field,
•constructing a special point. (using the button Construct Point , positioned next to the Snap Point field.
When you set a point object or plot a special point, an associative link is automatically created between this object (point) and the resulting vertex of the characteristic broken line. The applied links are marked with special icons in the Point parameters table. When you select a vertex, the name of the related object (point plotting method) is displayed in the Snap Point field. You can delete the link if needed. More details on the associative link...
4.Select the method to plot the next vertex using the Method group of buttons and plot the point. Available plotting methods:
•Plotting by coordinates — see above.
•Constructing in the direction of one of the axes — press the button corresponding to the desired axis (, , or ), and specify the point displacement. Details...
•Building in the direction that is parallel or perpendicular to an object — press the button corresponding to the required direction ( or ), select the guiding object, and specify the point's displacement. Details…
5.Plot the other vertices of the characteristic broken line the same way.
When specifying vertices, you can view their parameters: for a newly specified vertex — in the group of elements Vertex Design, and for already specified vertices — in the Point parameters table, located in the Vertex Coordinates group.
A phantom of the spline and the characteristic broken line with current settings are displayed in the graphic area. The phantom may look different depending on the state of the Close Curve option.
6.If you need to edit the spline configuration, please switch to the editing mode. In this mode, the following actions are available:
•change the position of the vertices of the defined broken line, choose other plotting methods
Changing the position of points
•delete vertices, create vertices on existing parts of a defined broken line
Inserting an aggregate of points
7.After making changes, you can continue defining the vertices by going back to the Creation mode.
8.If necessary, make the spline shape smoother. Smoothness is achieved by the fact that the spline ceases to pass through some of the defined points. To control smoothness, use the Smoothening section on the Parameter Panel. Details...
9.You can select a coordinate system to place the spline. To do that, use the Coordinate System section. Details...
10.You cat set the name, color and display parameters of the created in the Properties section on the Parameter Panel.
11.To complete creating the spline, click Create Object .
The spline will appear in the graphic area, its icon will appear in the Design Tree . The given vertices of the characteristic broken line will also be displayed in the Design Tree.
12.To complete operation of the command, click Finish .
•You can use the geometrical calculator.
•You can set tolerances for operation parameters expressed as linear or angular values. To do this, use the Tolerance command located in the menu of the required parameter, or click the icon  displayed in the parameter field (the icon is displayed if a tolerance is assigned to the parameter value). More details on assigning tolerance...